Whether you are just starting with your Internet of Things (IoT) journey, or already have millions of connected IoT devices, you might be looking for ways to maximize the value extracted from your IoT data. IoT devices data can contain a wealth of information within its reported telemetry data, metadata, state, and commands and responses. However, having the right reporting and visualization solution is key to gain insights needed to maximize your operational efficiency and deliver business outcomes.
No one solution can fit every use-case, hence frameworks like the AWS Well-Architected help you to choose a solution that best fits from a management, performance, cost, and operations perspective. You might be looking for a reporting and visualization solution that can deliver data in real time. Or, maybe you want a solution that can be fully customizable, and gives you the ability to search for insights.
In this blog post, we will walk through the different IoT reporting and visualization solutions at AWS. We will review 7 different architectural patterns that can deliver reporting in real time, near real-time, and on schedules. Additionally, we will provide you with data points on use cases, refresh interval, data ingestion process, architecture, and complexity for each of the solutions.
Architectural Patterns
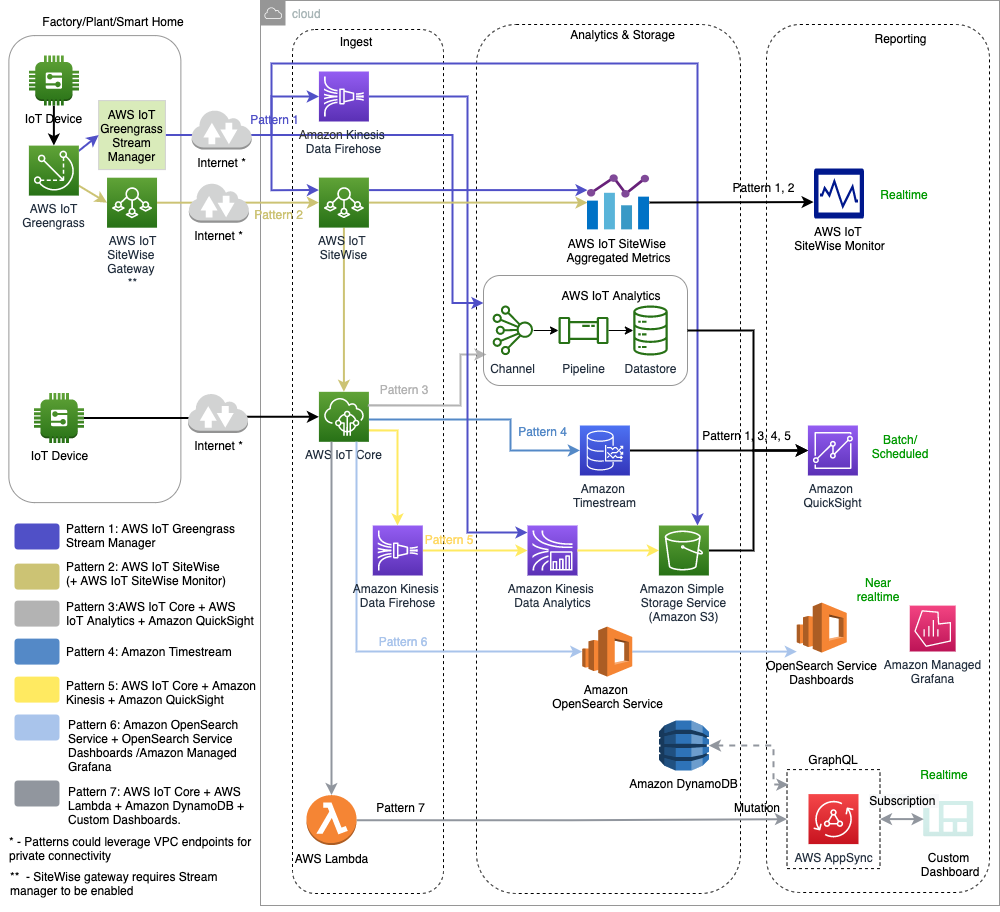
The following diagram shows a consolidated view of all architectural patterns, and details of each pattern are covered in the subsequent sections.
Pattern 1: AWS Stream Manager
Overview:
AWS IoT Greengrass stream manager makes it easier and more reliable to transfer high-volume IoT data to the AWS Cloud. Stream manager processes data streams locally and exports them to the AWS Cloud automatically. This feature integrates with common edge scenarios, such as machine learning (ML) inference, where data is processed and analyzed locally before being exported to the AWS Cloud or local storage destinations. Stream manager is designed to work in environments with intermittent or limited connectivity. You can define bandwidth use, timeout behavior, and how stream data is handled when the core is connected or disconnected.
Metrics & Analytics:
Stream manager supports exporting to the following key AWS destinations.
AWS IoT SiteWise: AWS IoT SiteWise lets you collect, organize, and analyze data from industrial equipment at scale.
Amazon Kinesis Data Streams: Kinesis Data Streams is commonly used to aggregate high-volume data and load it into a data warehouse or map-reduce cluster.
AWS IoT Analytics: AWS IoT Analytics lets you perform advanced analysis on your data to help make business decisions and improve machine learning models.
Amazon S3 Objects: You can use Amazon S3 to store and retrieve large amounts of data.
Reporting:
Reports will vary based on AWS service used. For example, AWS IoT SiteWise pattern highlights AWS IoT SiteWise Monitor for real-time monitoring and Kinesis Data Firehose pattern highlights using QuickSight for reporting.
Why this pattern is useful?:
For systems that don’t need fleet management or monitoring capabilities that AWS IoT Core provides, or don’t need to modify the data at the edge before routing the data to other services, this could be a great cost-effective solution.
To support custom embedded offline management and buffering optimization. Your IoT applications can define policies for storage type, size, and data retention on a per-stream basis to control how stream manager processes and exports streams.
Pattern 2: AWS IoT SiteWise (+ AWS IoT SiteWise Monitor)
Overview:
AWS IoT Greengrass software installed on your device provides an open-source edge runtime and cloud service that helps you build, deploy, and manage intelligent device software. Using AWS IoT SiteWise components, you can integrate with Greengrass to send local device and equipment data to asset properties in AWS IoT SiteWise on AWS cloud. Through the AWS IoT SiteWise Edge software you can then easily collect, organize, process, and monitor equipment data on-premises.
Metrics & Analytics:
AWS IoT SiteWise supports computing performance metrics for your equipment and processes. These metrics can help identify various types of wastes such as equipment issues, production gaps, and quality defects. AWS IoT SiteWise data is available in AWS IoT Core and can be made available to AWS IoT Analytics or other analytics services like Amazon Kinesis via rules for AWS IoT Core
Reporting:
AWS IoT SiteWise monitor can automatically discover and visualize data from assets that have already been ingested and modeled with AWS IoT SiteWise. It provides a fully managed web application out of the box without having to write code.
AWS IoT SiteWise for Grafana plugin allows Grafana dashboards to monitor data stored by AWS IoT SiteWise in the AWS Cloud.
Why this pattern is useful?:
Improve manufacturing operations: Monitor performance metrics from manufacturing lines, assembly robots, and factory equipment to discover and act on opportunities for improvement.
Optimize asset maintenance: Prevent, detect, and resolve equipment issues faster through remote asset monitoring using historical and near-real-time data.
View live trend charts of asset data (no-code, fully-managed web applications)
Pattern 3: AWS IoT Core + AWS IoT Analytics + Amazon QuickSight
Overview:
AWS IoT Core enables connected devices to easily and securely interact with cloud applications and other devices. With AWS IoT Core, your applications can keep track of and communicate with all your devices, all the time, even when they are offline. Data collected from devices can be sent via MQTT messages to AWS IoT Core and an IoT rule can be used to ingest data to AWS IoT Analytics which helps to analyze the data.
Metrics & Analytics:
AWS IoT Analytics automates the steps required to analyze data from IoT devices. AWS IoT Analytics filters, transforms, and enriches IoT data before storing it in a time-series data store for analysis. You can set up the service to collect only the data you need from your devices, apply mathematical transforms to process the data, and enrich the data with device-specific metadata such as device type and location before storing it. Then, you can analyze your data by running queries using the built-in SQL query engine, or perform more complex analytics and machine learning inference.
Reporting:
AWS IoT Analytics enables advanced data exploration through integration with Jupyter Notebook. AWS IoT Analytics also enables data visualization through integration with Amazon QuickSight. Amazon QuickSight is available in the following Regions.
Why this pattern is useful?:
Ease of use: AWS IoT Analytics is very well integrated with AWS IoT Core and helps to collect, process, store, analyze and build on IoT data. It’s completely serverless and low-code (can be extended with Lambdas)
Predictive maintenance: AWS IoT Analytics provides pre-built templates to help you easily build powerful predictive maintenance models and apply them to your fleet
Perform comprehensive analysis: AWS IoT Analytics can automatically enrich IoT device data with contextual metadata using the AWS IoT Registry and other public data sources so that you can perform analysis that factors in time, location, temperature, altitude, and other environmental conditions
Automate anomaly detection: AWS IoT Analytics enables you to automate your anomaly detection workflow using Amazon SageMaker to gain insights via ML workflows. You can read more about using containerized Jupyter notebooks with AWS IoT Analytics here
Pattern 4: Amazon Timestream
Overview:
In this pattern you start by publishing time series data to AWS IoT core and then data can be pushed to Amazon Timestream through built in IoT rule and the data can be visualized using various dashboarding option.
Metrics & Analytics:
The IoT rule for Amazon Timestream writes data from MQTT messages to an Amazon Timestream Database. You can then use tools like Amazon QuickSight to query and visualize data. For more details refer to Timestream rule action.
Tip for timestream: If you want to optimize the number of write operations on the DB, follow the batch write approach listed here.
Reporting:
Along with using Amazon QuickSight you can also use Amazon managed Grafana as your dashboarding and alerting tool. For more details refer to Timestream-Grafana integration.
Why this pattern is useful?:
This pattern is useful if you are looking to perform analytical functions on your device data such as such as smoothing, approximation, and interpolation (built-in support via Amazon Timestream). For example, a smart home device manufacturer can use Amazon Timestream to collect motion or temperature data from the device sensors, interpolate to identify the time ranges without motion, and alert consumers to take actions such as turning down the heat to save energy.
Pattern 5: AWS IoT Core + Amazon Kinesis + Amazon QuickSight
Overview:
In this pattern, you start by publishing data to AWS IoT core which integrates with Amazon Kinesis allowing you to collect process and analyze large bandwidth of data in real time. Data can be visualized using Amazon QuickSight.
Metrics & Analytics:
Amazon Kinesis Data Analytics allows you gain actionable insights from streaming data. With Amazon Kinesis Data Analytics for Apache Flink, customers can use Java, Scala, or SQL to process and analyze streaming data. The service enables you to author and run code against streaming sources to perform time-series analytics, feed real-time dashboards, and create real-time metrics.
Reporting:
For reporting you can use Amazon QuickSight for batch and scheduled dashboards. If the use-case demands a more real-time dashboard capability, you can use Amazon OpenSearch with OpenSearch Dashboards pattern
Why this pattern is useful?:
If your application involves high bandwidth streaming datapoints, then this pattern provides the ability to analyze that high bandwidth and real-time steaming data so that you can derive actionable insights.
Pattern 6: Amazon OpenSearch Service + OpenSearch Service Dashboards/Amazon Managed Grafana
Overview:
In this pattern, you can start by publishing data to AWS IoT core and then data can be pushed to Amazon OpenSearch service through built in IoT rule and the data can be visualized using various dashboarding option.
Metrics & Analytics:
The OpenSearch IoT rule action writes data from MQTT messages to an Amazon OpenSearch Service domain. You can then use tools like OpenSearch Dashboards to query and visualize data in OpenSearch Service. For more details refer to OpenSearch rule action.
Reporting:
Along with using Amazon OpenSearch Dashboards you can also use Amazon managed Grafana as the dashboarding options. With Amazon Managed Grafana, you can add the Amazon OpenSearch Service as a data source by using the AWS data source configuration option in the Grafana workspace console. For further information on how to set this up please refer to Grafana plugin for OpenSearch.
Why this pattern is useful?:
If you are looking to monitor device heath or device metrics, then this pattern provides the ability to search on the underlying data, perform custom configurations and get real-time dashboard application.
Pattern 7: AWS IoT Core + AWS Lambda + Amazon DynamoDB + Amazon QuickSight / Custom Dashboards
Overview:
In this pattern, you can visualize a real-time telemetry data sent directly from IoT devices via AWS IoT Core using AWS Lambda, Amazon DynamoDB, AWS AppSync and a custom dashboard of your choice.
IoT Rules for AWS IoT Core will send the MQTT message to an AWS Lambda function. The Lambda function can format the message and then executes an AWS AppSync GraphQL mutation. The mutation call will save the message in an Amazon DynamoDB table, and broadcast the message in real-time to the custom dashboard. The custom dashboard subscribes to the AWS AppSync subscription which will receive the updated message. You can read more about this pattern here.
Metrics & Analytics:
The IoT data will be stored in Amazon DynamoDB table. In order to perform advanced analytics, you need to export the data into an analytics platform. This can be achieved by building a data pipeline that transition the data into Amazon S3, and then use Amazon Athena, to run advanced analytics. For more details, refer to the Amazon Athena blog post that performs advanced analytics & visualizations.
Reporting:
You can easily create and launch custom dashboards and mobile applications using AWS Amplify. The custom dashboard can communicate with AWS AppSync through the AWS Amplify Framework such as iOS, Android, React Native, Flutter, React and Vue.
Why this pattern is useful?:
This pattern is a great fit for use cases when IoT data needs to be delivered to end users as soon as it changes via a custom real-time dashboard. Users can access data using custom and configurable front-end clients
This pattern is also a great fit for mobile applications that help consumers monitor their home appliances in real-time (can be activated only on-demand)
Considerations and caveats
No one size fits all – All the architectural patterns mentioned in this post are focusing on the most feasible path; however, every use case is different and so most of the patterns can be tweaked to add other relevant services to add additional capabilities or get over any deficiencies. If none of the patterns meet your requirement, look at the credential provider pattern to authorize direct calls and integrate with AWS services (including AWS IoT services)
Costs: Every pattern has its own cost model and it can vary substantially based on the number of devices and amount of data in your application. It is important for you to factor in these considerations while choosing a pattern.
Region specific services: Not every service may be available in every region so do evaluate a service before choosing a pattern
Conclusion
In this post, we reviewed the different architectural patterns to build IoT data reporting and visualization solutions on AWS. We discussed how each pattern can address different needs and requirements. Whether you need a real time reporting, real time analytics, or historical trending reporting, choose a solution that aligns with your business needs.
Start your journey on AWS IoT services.
About the authors
Umesh Kalaspurkar
Umesh Kalaspurkar is a New York based Solutions Architect for AWS. He brings more than 20 years of experience in design and delivery of Digital Innovation and Transformation projects, across enterprises and startups. He is motivated by helping customers identify and overcome challenges. Outside of work, Umesh enjoys being a father, skiing, and traveling.
Ameer Hakme
Ameer Hakme is an AWS Solutions Architect based in Pennsylvania. He works with Independent software vendors in the Northeast to help them design and build scalable and modern platforms on the AWS Cloud. In his spare time, he enjoys riding his motorcycle and spend time with his family.
Ravikant Gupta
Ravi Gupta is an Enterprise Solutions Architect at Amazon web services. He is a passionate technology enthusiast who enjoys working with customers and helping them build innovative solutions. His core areas of focus are IoT and Machine learning. In his spare time, Ravi enjoys spending time with his family and photography.
Leave a Reply
You must be logged in to post a comment.


